

Detroit homes sat on the market a median of 39 days across the Detroit-Warren-Dearborn metro in July 2026, roughly flat from June and down from a 45-day reading in March. Realtor.com’s separate city-level tracker put Detroit proper at 40 days around the same period. Either way, the market is still moving faster than the national median, which gives sellers a real pricing edge but leaves less room for buyers to stall on a decision.
TL;DR:
- Homes in Detroit are selling faster in neighborhoods near downtown, Midtown, or along the riverfront, often within one to two weeks, compared to the overall city median of around 40 days.
- The median days on market fluctuate with inventory levels, pricing accuracy, interest rates, seasonality, and buyer demand, which can change month to month.
- A 39-day median indicates a market with momentum but not a frenzy, so sellers should price competitively and stage effectively, while buyers need swift decision-making in active neighborhoods.
- Cash buyers can close deals as quickly as seven days, significantly reducing the sale timeline compared to financed transactions, which typically take 30 to 60 days.
- Local market data sources differ in how they measure days on market, so referencing neighborhood-specific trends and recent sold comparables offers the clearest picture for decision-making.
Table of Contents
- How Days on Market Varies by Detroit Neighborhood
- What Speeds Up or Slows Down a Detroit Home Sale
- What Detroit’s Days on Market Means for Buyers and Sellers
- Where to Check Current Detroit DOM Data
- Reading Detroit’s Market Pace Correctly
- Find a Vetted Detroit Agent or Cash Buyer Through CompareSpot
- Sources
- FAQ
How Days on Market Varies by Detroit Neighborhood
A citywide median hides more than it reveals. Move-in-ready homes in stronger corridors, near downtown, Midtown, or along the riverfront, typically go pending faster than the city median suggests, sometimes in a week or two. Homes in outlying neighborhoods with more deferred maintenance or thinner buyer demand can sit for two or three months, even while the metro-wide number reads in the high 30s or low 40s.

Home type matters just as much as location. Turnkey single-family homes under $200,000 tend to draw multiple showings in the first weekend. Larger, higher-priced properties, and homes needing significant repair work, move at a slower pace regardless of ZIP code.
Zillow’s research found that close to one in five homes nationally sell within a week in strong micro-markets, a pattern that shows up in Detroit’s hottest pockets even when the city average sits closer to 40 days. If you want a number specific to your block rather than the whole city, pull it from a live tool:
- Search your ZIP code directly on Realtor.com or Redfin’s local market pages for the most recent sold comparables.
- Filter by property type and price band, not just geography, since a $600,000 listing and a $90,000 listing rarely sell on the same timeline.
- Cross-check the date range, since a three-month rolling average reads very differently than a single-month snapshot.
What Speeds Up or Slows Down a Detroit Home Sale
Days on market is not a fixed number. It moves with a handful of forces that shift month to month, and understanding them helps you read the current data instead of just repeating it.
- Inventory versus demand. When new listings outpace buyer activity, homes sit longer even if nothing is wrong with them, simply because shoppers have more to compare.
- Pricing accuracy. A home priced within a few percent of true market value in its first two weeks typically draws the strongest activity; overpriced listings often sit, get a price cut, and reset the buyer pool’s interest.
- Interest rates and financing friction. Higher rates narrow the pool of qualified buyers and slow down mortgage approvals, both of which stretch the timeline from listing to closing.
- Seasonality. Late spring through early summer tends to bring the most competitive buyer activity in Metro Detroit, while winter listings often take longer simply because fewer buyers are actively touring.
- Cash buyers and investor demand. A cash offer skips the mortgage underwriting step entirely, which can cut weeks off the path to closing compared to a financed deal.
Pro Tip: If your listing hits day 21 with no offers, don’t wait for day 45 to reconsider. A price adjustment in week three almost always outperforms one made after the listing has gone stale in buyers’ search alerts.
What Detroit’s Days on Market Means for Buyers and Sellers

A 39-day metro median and a 40-day city median both point to a market with real but not extreme urgency. Neither number means panic, but neither means you can afford to be slow either.
If you’re selling:
- Price within your neighborhood’s realistic range from day one rather than testing the market high.
- Have staging and photography ready before listing day, since the first two weeks generate the bulk of buyer traffic.
- If speed matters more than top dollar, weigh a cash buyer against a traditional listing or consider FSBO if you want to control the process directly.
If you’re buying:
- In faster-moving neighborhoods, be ready to make a decision within days, not weeks, once you find a home that fits.
- In slower-moving areas, you have more room to negotiate on price or ask for repairs before signing.
- Watch the gap between days-to-pending and days-to-close. A 39-day median to go pending can still mean another 30 to 45 days before the deal actually closes.
Cash transactions can compress that back half of the timeline dramatically. CompareSpot’s own local research has tracked cash closings running as fast as seven days, compared to 30 to 60 days for a financed sale.
Where to Check Current Detroit DOM Data
Four sources cover this number from different angles, and each is worth bookmarking depending on what you need.
- Start with FRED’s MEDDAYONMAR19820 series for the official metro-wide monthly trend, updated regularly and free to chart back several years.
- Cross-reference Realtor.com’s local market reporting for city-specific figures and narrative context on what’s driving the number that month.
- Check Redfin’s Detroit market page and DetroitData’s historic dataset for neighborhood-level detail and long-run comparisons back to 2018.
Whichever source you use, note whether it measures days to pending or days to close, and whether it counts relisted homes as new listings. That single methodology difference explains most of the gap you’ll see between providers.
Reading Detroit’s Market Pace Correctly
The number that gets quoted most, whether it’s 39 days from FRED or 40 from Realtor.com, tells you less about any single house and more about how quickly buyer demand is absorbing what’s on the shelf right now. A metro median in the high 30s is a market with momentum, not a frenzy, and that distinction should shape how aggressively you price or negotiate.
What I’d tell a homeowner right now: don’t anchor to a citywide average if your block behaves nothing like it. Pull the ZIP-level number, compare it against your home’s condition and price tier, and treat the metro figure as context rather than a prediction. CompareSpot’s editorial team tracks these patterns across Wayne, Oakland, and Macomb counties specifically because a 39-day metro median can mean a 12-day sale in one neighborhood and a 70-day sale two miles away. If you’re deciding whether to list now or wait, start by checking your specific submarket’s recent sold data before you set a price.
— Bryan
Find a Vetted Detroit Agent or Cash Buyer Through CompareSpot
Comparespot is the alternative to guessing which local agent or cash buyer actually performs, ranking Metro Detroit real estate providers through independent research and customer sentiment rather than paid placement. If the current 39-day median tells you speed matters, the next decision is who you work with to hit that timeline or beat it.
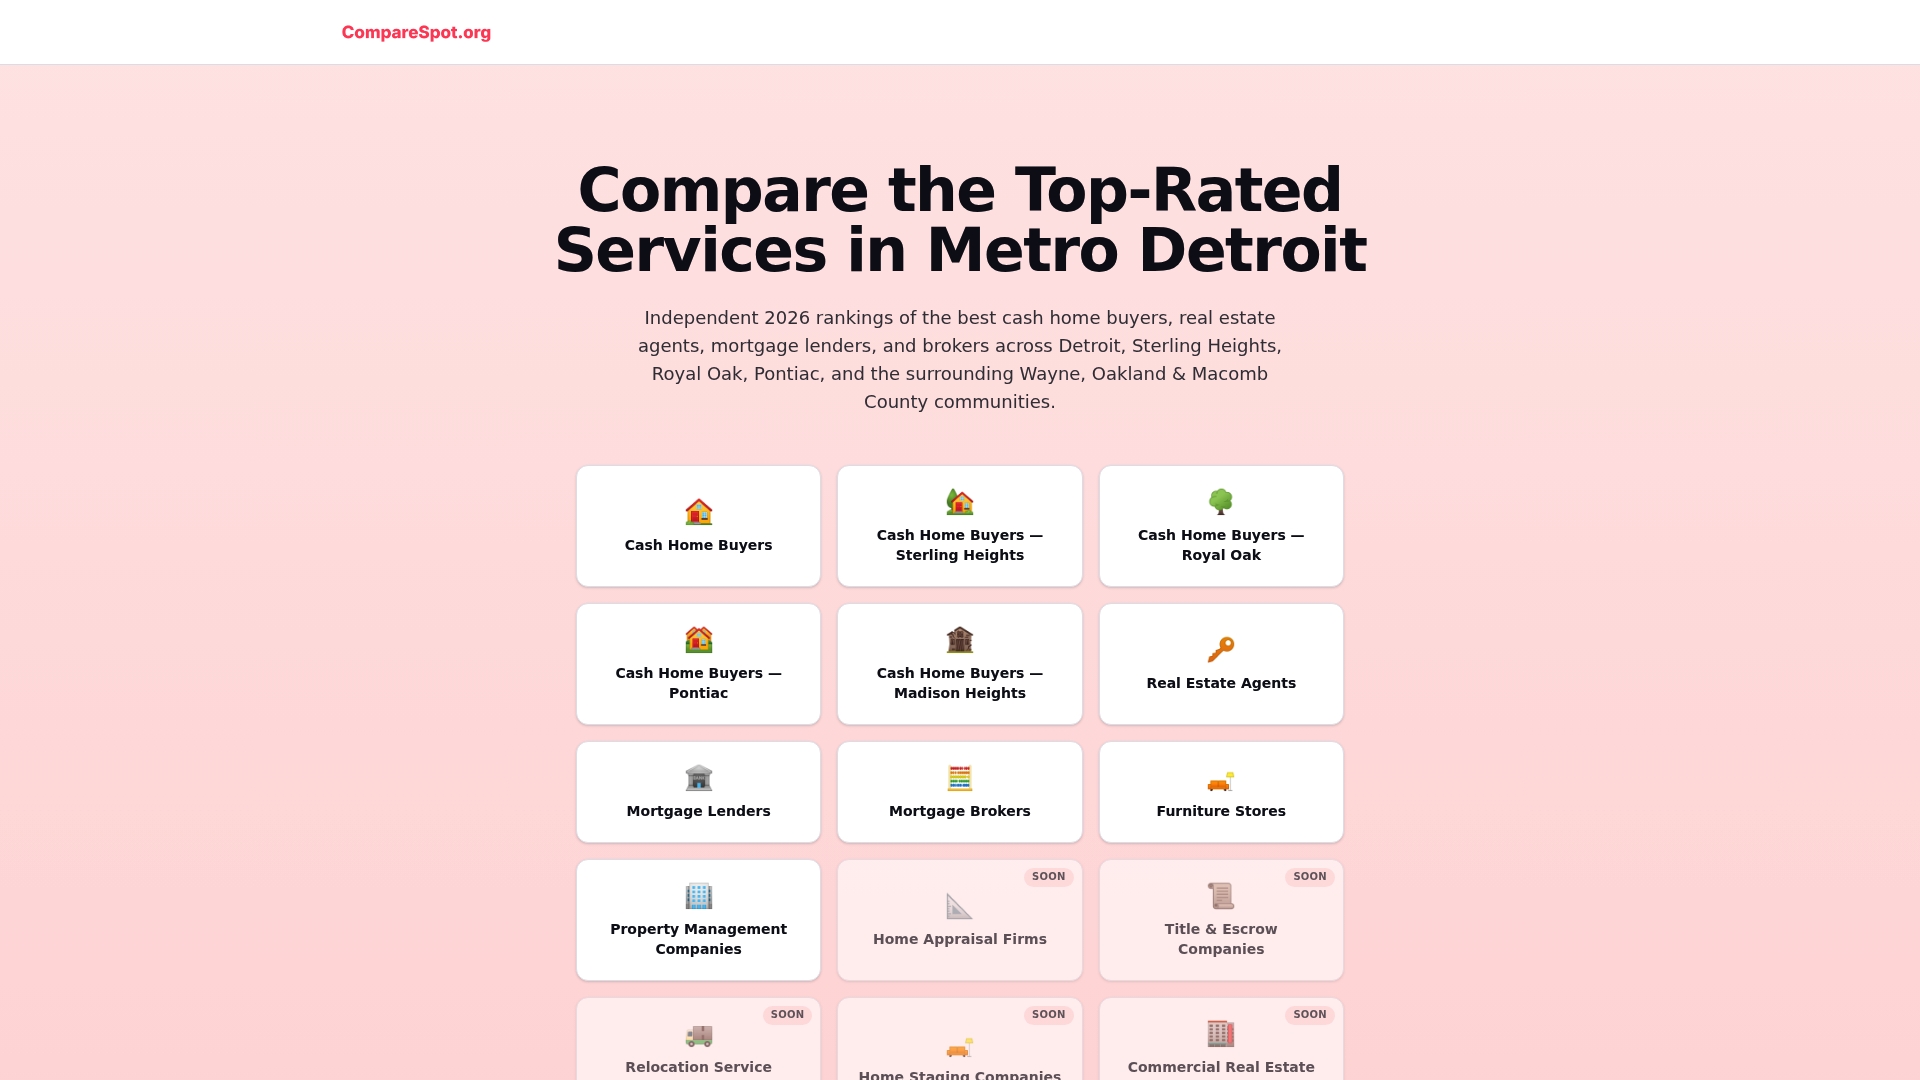
Sellers who want maximum reach can browse the top-rated real estate agents in Metro Detroit, while anyone prioritizing a fast, certain close can compare cash home buyers across Metro Detroit or check city-specific rankings for Royal Oak and Sterling Heights. Buyers financing a purchase can also compare mortgage lenders serving the metro before locking in a rate. None of this replaces good local judgment, but it saves the hours you’d otherwise spend vetting providers one by one. Visit Comparespot’s Metro Detroit rankings to see this month’s top performers by category.
Sources
FRED’s MEDDAYONMAR19820 series tracks the metro CBSA monthly. Realtor.com’s local market reports cover city-level trends. Redfin’s Detroit page and DetroitData’s historic dataset add neighborhood and long-run detail. For seller-side tactics, BlueKey Home Buyers’ quick-sale guide and AAS Home Buyers’ practical selling guide offer additional context.
- Housing Inventory: Median Days on Market in Detroit-Warren-Dearborn, MI (CBSA) (MEDDAYONMAR19820)
- Real Estate Market Trends in Detroit, MI: Prices Fall
- Detroit, MI Housing Market
FAQ
Are there signs of home prices dropping in Michigan in 2026?
Realtor.com’s local reporting has flagged softening price growth in parts of Metro Detroit tied to rising inventory, even as days on market stays historically moderate. Rising DOM alongside flat prices, rather than an outright price collapse, is the pattern to watch for in the coming months.
What is the wealthiest suburb of Detroit?
Suburbs like Bloomfield Hills and Grosse Pointe consistently rank among the highest-income communities in Metro Detroit, driven by larger lot sizes and premium school districts. These areas typically see different days-on-market patterns than the city median, often moving faster or slower depending on the specific price tier.
Can you buy a house in Detroit for $1,000?
Extremely low-priced listings do occasionally appear in Detroit, usually distressed properties requiring major repairs or back taxes owed, but they represent a small, high-risk slice of the market rather than a typical purchase path. Most buyers should expect a wide price range depending on neighborhood and condition, and should budget for renovation costs on any deeply discounted property.
Will the housing market crash in 2026?
Current data shows Detroit’s median days on market holding in the high 30s to low 40s, a pace consistent with a balanced market rather than one heading toward a crash. Rising inventory has been noted in Realtor.com’s coverage, but that typically shows up first as slower price growth, not a sudden collapse.
How is days on market actually calculated?
Days on market counts the time between a home’s listing date and either its pending status or its closing date, depending on the provider’s methodology. FRED, Realtor.com, and Redfin can report different numbers for the same market because they measure different endpoints and handle relisted properties differently, which is why checking the source and month matters before comparing figures.